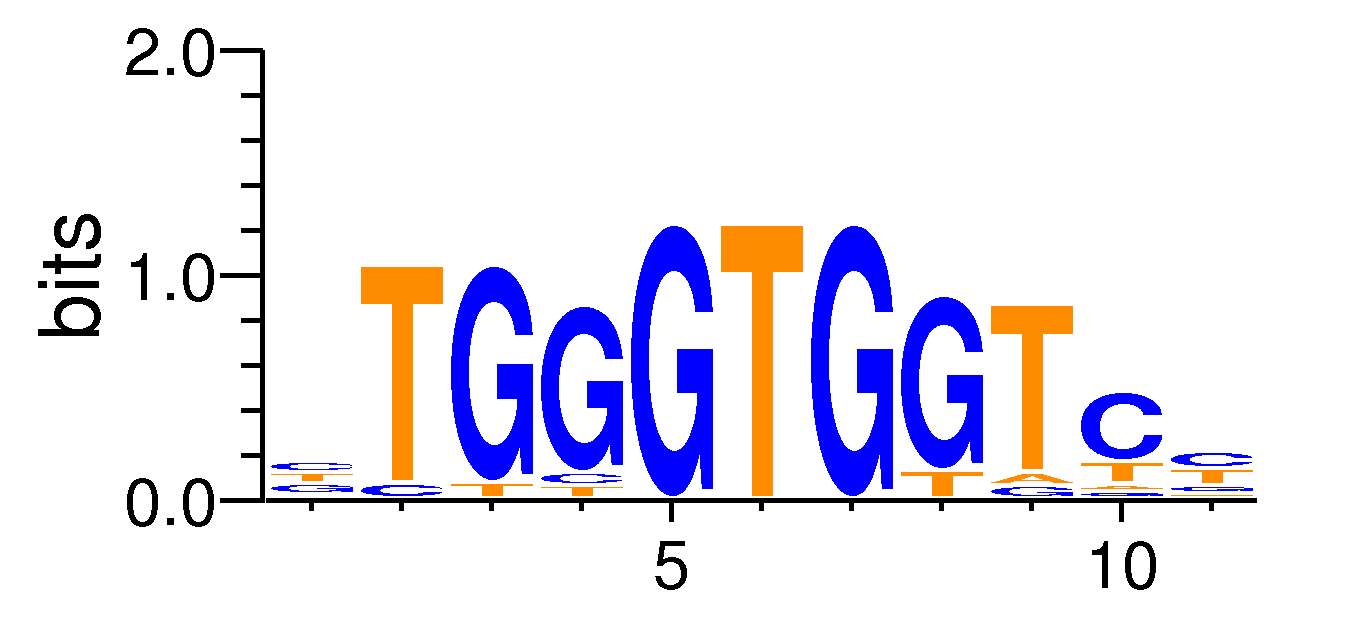
Full Name: GLI3_si

| Motif matrix
|
| PO | A | C | G | T | | 1 | 1.5398351648351538 | 4.567307692307673 | 4.462912087912083 | 4.567307692307673 | | 2 | 0.0 | 1.0439560439560411 | 0.0 | 14.093406593406563 | | 3 | 0.0 | 0.0 | 14.093406593406563 | 1.0439560439560411 | | 4 | 0.0 | 1.0439560439560411 | 13.049450549450526 | 1.0439560439560411 | | 5 | 0.0 | 0.0 | 15.1373626373626 | 0.0 | | 6 | 0.0 | 0.0 | 0.0 | 15.1373626373626 | | 7 | 0.0 | 0.0 | 15.1373626373626 | 0.0 | | 8 | 0.0 | 0.0 | 13.049450549450526 | 2.0879120879120885 | | 9 | 1.0439560439560411 | 0.0 | 1.0439560439560411 | 13.049450549450526 | | 10 | 1.0439560439560411 | 9.9175824175824 | 1.0439560439560411 | 3.131868131868125 | | 11 | 1.5398351648351538 | 5.611263736263725 | 2.5837912087912054 | 5.402472527472515 |
|
Sample specificity
The values shown are the p-values of the motif in FANTOM5 samples. <br>Analyst: Michiel de Hoon
TomTom analysis
<br>Analyst: Michiel de Hoon and Hiroko Ohmiya
No results for this motif
