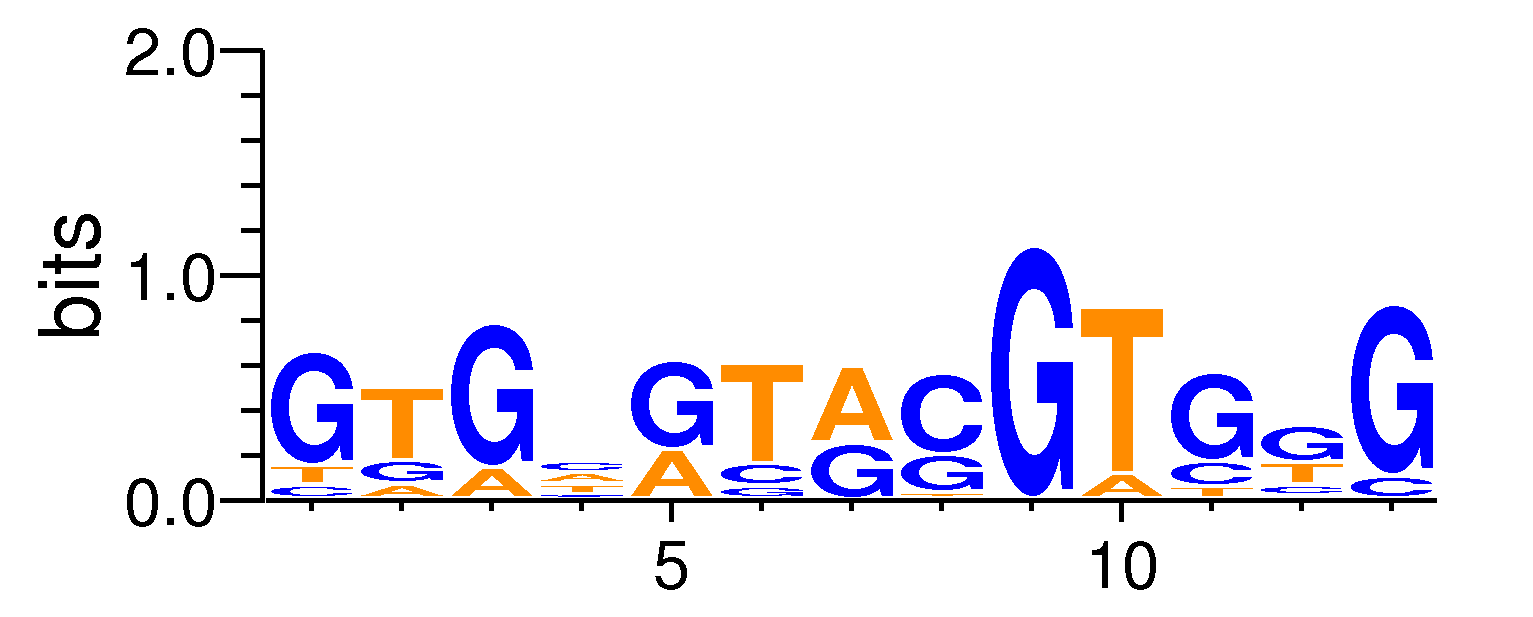
Full Name: EPAS1_si

| Motif matrix
|
| PO | A | C | G | T | | 1 | 0.0 | 1.1179636129823016 | 9.31688732884248 | 1.565149058175228 | | 2 | 1.565149058175228 | 0.0 | 2.571316309859292 | 7.86353463196548 | | 3 | 2.124130864666368 | 0.0 | 9.875869135333632 | 0.0 | | 4 | 3.6273454623392283 | 3.7391418236374676 | 1.453352696876988 | 3.1801600171463162 | | 5 | 4.298123630128608 | 0.0 | 7.70187636987138 | 0.0 | | 6 | 0.0 | 2.01233450336814 | 1.1179636129823016 | 8.869701883649554 | | 7 | 6.919301840783771 | 0.0 | 5.080698159216228 | 0.0 | | 8 | 0.0 | 7.81367273116962 | 3.6273454623392283 | 0.5589818064911508 | | 9 | 0.0 | 0.0 | 12.0 | 0.0 | | 10 | 1.565149058175228 | 0.0 | 0.0 | 10.434850941824772 | | 11 | 0.0 | 2.4595199485610637 | 8.422516438456633 | 1.1179636129823016 | | 12 | 0.5589818064911508 | 1.7887417807716839 | 6.024930950397936 | 3.6273454623392283 | | 13 | 0.0 | 1.453352696876988 | 10.546647303123013 | 0.0 |
|
Sample specificity
The values shown are the p-values of the motif in FANTOM5 samples. <br>Analyst: Michiel de Hoon
TomTom analysis
<br>Analyst: Michiel de Hoon and Hiroko Ohmiya
No results for this motif
