
Why Develop Cap Analysis of Gene Expression?
Research by Piero Carninci and Yoshihide Hayashizaki in the late 1990s, which started with the cap trapper method, use of trehalose, the normalization/subtraction method, and a new cloning vector, set the stage for development of Cap Analysis of Gene Expression. With cap trapper, full-length cDNA/mRNA hybrids are isolated, and the mRNA is chemically biotinylated on the cap structure and streptavidin-coated magnetic beads capture the hybrids. This advance in the series of major DNA technologies is described by Nature as Milestone 5 (www.nature.com/milestones/miledna/full/miledna05.html). Their purpose in developing CAGE was to create a technology for comprehensively mapping the vast majority of human transcription starting sites and their promoters. In fact, the technology to profile the activity of gene transcription at each promoter site did not exist until CAGE came on the scene. Messenger RNA (mRNA) represents a critical link between the information encoded in individual genes on a genome and the protein makeup that determines an organism’s fate. We asked ourselves: what are the genomic regions, or promoters, that drive the specific expression of genes and their uniquely different RNAs? Indeed, full-length cDNA collections have shown that most genes have more than one transcription starting site and thus it is quite difficult to identify the controlling regions, that is promoters, responsible for the expression of the various forms of transcripts.
Analyzing the complexity of this information transfer process, called ‘transcription’, requires the development of sophisticated molecular tools that can capture both the qualitative and quantitative aspects of gene expression. So with CAGE, our original genome-wide transcription starting detection technology, we can do high-throughout gene expression profiling with simultaneous identification of the tissue/cell/condition specific transcriptional start sites (TSS), including promoter usage analysis. CAGE is based on preparation and sequencing of concatamers of DNA tags deriving from the initial 20 nucleotides from 5’ end mRNAs, which reflect the original concentration of mRNA in the analyzed sample (RNA frequency).
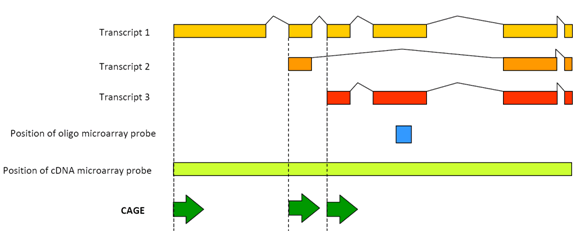
Figure 1: CAGE detects the transcriptional activity of each promoter transcript.
Expressed sequencing tags (ESTs) were used in early stages of technology development to identify promoter elements by aligning them onto the human genome. However, this process is very expensive because of the costs of handling physical cDNAs and Sanger sequencing. One way to overcome these problems is to use tagging technologies[1], which have been developed to detect transcripts with a sensitivity that is at least one order of magnitude greater than EST sequencing, then exhaustively identify transcripts[2], identify their promoters and correlate them with expression profiles by counting the tags as a digital measure of gene expression[3].
These sequences (also called “tags”) are then aligned to genome sequences by simple computational procedures (called BLAST) and counted, which gives a measurement of frequency of RNA expression. As these sequence tags identify the starting sites of the RNA transcription, they also identify the genome sequences close to those starting sites. The neighboring regions are the core promoter regions, which are genomic sequences that cause genes to be transcribed at the many different conditions that are encountered in many complex organisms, from mice to humans.
Attributes of CAGE
CAGE has great advantages compared to classic microarray-based expression detection techniques. In fact, by identifying the promoter that cause RNA transcription in each biological phenomena, tissue, cell etc. we can identify the DNA regulatory elements that are specific for each biological phenomenon by looking at the sequences that are in the promoters of the RNA isoforms being expressed in the analyzed samples. Promoters contain specific sequences, or transcription factor binding sites (TFBS), that are recognized by their binding proteins called transcription factors (TF) and promote, or alternatively repress, transcription. Using computational methods, our researchers analyze promoters having similar expression profiles for their TFBS and then identify the TFs responsible for the transcriptional output of the genome. By counting the number of CAGE tags for each promoter within a gene, we can now determine not only the RNA expression level (this is a digital detection of frequency) but, importantly, also from which of the various alternative promoters the RNA is transcribed.
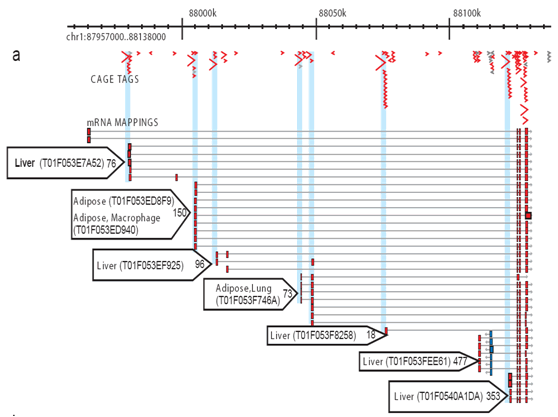
Figure 2: CAGE allows the comprehensive profiling of activates at each promoter site. For each library, a number of CAGE tags are sequenced and aligned to the genome so the specific transcriptional activity at each promoter can be measured and the contribution of each promoter distinguished. This simplified example shows adipose and liver core promoters. Tiny blue arrows: individual CAGE tags; red arrows: promoter usage preference for tissues; red boxes: core promoter regions.
As mentioned, CAGE uses cap-trapping as the first step to capture the 5’ ends of the cDNAs, which are then transformed into short sequence (tags) of 20 to 27 nt corresponding to the mRNA TSSs[4], [5]. We have produced millions of mouse and human CAGE tags[6] using concatenated CAGE tags with Sanger sequencing, until we recently moved to deepCAGE, for which we use second-generation sequencing.
Until 2006 we were running CAGE libraries on our original RISA sequencing pipeline, which was constructed in the late 90’s and included the only capillary sequencer with an array of 384 capillaries that we developed in collaboration with the Shimadzu Corporation.
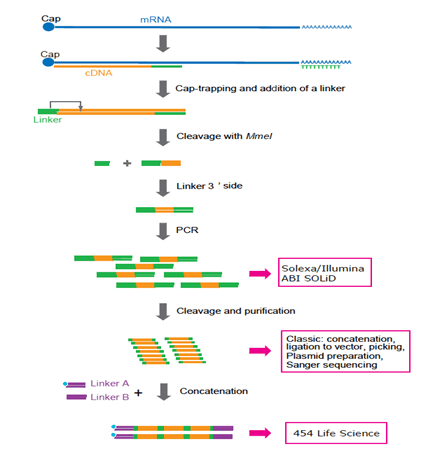
Figure 3: Representation of CAGE preparation protocol adapted to various platforms. Now Solexa and Illumina are preferred. 454 Life Sciences (FLX system) is not used any longer because concatenation requires additional PCR cycles and complicated manipulation. In the future, single-molecule sequencing technology will be preferred because PCR may not be required.
Although tagging and sequencing technology has been developed using the serial analysis of gene analysis (SAGE) method [7],[8], CAGE is unique because it is based on the principle of profiling the 5’ end of RNAs carrying a cap-site – all mRNAs and a large fraction of the non-coding RNAs. We have developed 27-nt long CAGE tags to increase the mapping efficiency.
References
- ^ Harbers, M. & Carninci, P. Tag-based approaches for transcriptome research and genome annotation. Nat Methods 2, 495-502 (2005), doi: 10.1038/nmeth768
- ^ Ng, P. et al. Gene identification signature (GIS) analysis for transcriptome characterization and genome annotation. Nat Methods 2, 105-11 (2005), doi: 10.1038/nmeth733
- ^ Nilsson, P. & Virtanen, A. Expression and purification of recombinant poly(A)-specific ribonuclease (PARN). Int J Biol Macromol 39, 95-9 (2006), doi: 10.1016/j.ijbiomac.2006.02.025
- ^ Kodzius, R. et al. CAGE: cap analysis of gene expression. Nat Methods 3, 211-22 (2006), doi: 10.1038/nmeth0306-211
- ^ Shiraki, T. et al. Cap analysis gene expression for high-throughput analysis of transcriptional starting point and identification of promoter usage. Proc Natl Acad Sci U S A 100, 15776-81 (2003), doi: 10.1073/pnas.2136655100
- ^ Carninci, P. et al. Genome-wide analysis of mammalian promoter architecture and evolution. Nat Genet 38, 626-35 (2006), doi: 10.1038/ng1789
- ^ Velculescu V. et al. Characterization of the yeast transcriptome Cell 88:2, 243-251 (1997), doi: 10.1016/S0092-8674(00)81845-0
- ^ V.E. Velculescu, L. Zhang, B. Vogelstein and K.W. Kinzler, Serial analysis of gene expression, Science 270: 484-487 (1995), doi: 10.1126/science.270.5235.484