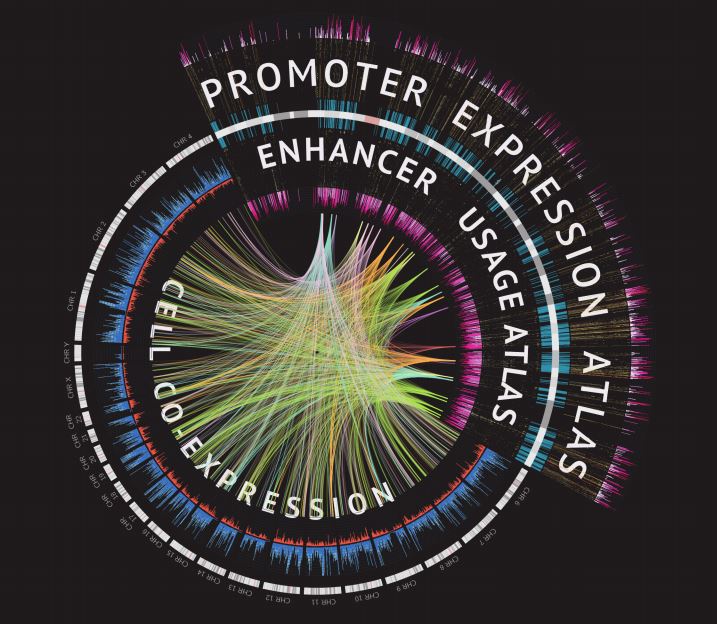
Introduction to FANTOM5
We are complex multicellular organisms composed of ~400 distinct cell types. This diversity of cell types allow us to see, think, hear, fight infections etc. yet all of this is encoded in the same genome. The difference between all these cells is what parts of the genome they use – for instance, neurons use different genes than muscle cells, and therefore they work very differently. In FANTOM5, we have systematically investigated exactly what are the sets of genes used in virtually all cell types across the human body, and the genomic regions which determine where the genes are read from. We aim to use this information to build transcriptional regulatory models for every primary cell type that makes up a human.
FANTOM5 Phase 2
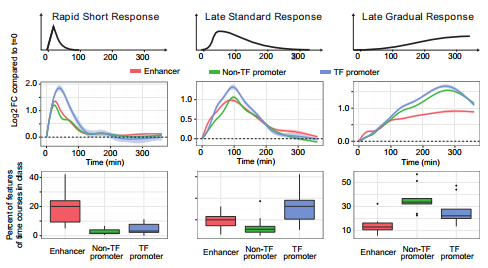
Using a comprehensive analysis of RNA expression in different cell types, scientist from the RIKEN-led FANTOM5 consortium have made major strides toward resolving an outstanding mystery in biology. In the work, published in Science, they showed that when cells undergo phenotype changes such as differentiation into specialized cell types, the initial activation happens at DNA regions called enhancers, a type of regulatory “switches” which are typically located far from the genes that they activate.
FANTOM5 Phase 1
Using Cap Analysis of Gene Expression (CAGE) we have mapped the sets of transcripts, transcription factors, promoters and enhancers active in the majority of mammalian primary cell types and a series of cancer cell lines, and tissues, which is described in two landmark papers in Nature. Around 30 publications from the project cover areas as diverse as primary cells, gene families, genome wide observations on promoter features and new bioinformatics tools.
FANTOM5 collection
A collection of FANTOM5 articles published in the Nature Publishing Group (NPG) is provided.
shortcut links | |||
|---|---|---|---|
| organism | atlas | tools | data files |
| human |
Promoter atlas Enhancer atlas lncRNA atlas |
UCSC Genome Browser |
Promoter (CAGE peaks) |
| mouse |
Promoter atlas |
Promoter (CAGE peaks) |
|
| rat |
Promoter atlas |
||
| dog |
Promoter atlas |
||
| chicken |
Promoter atlas |
||
| rhesus monkey |
Promoter atlas |
||
Views and Data
Various resources are now available to access FANTOM5 data
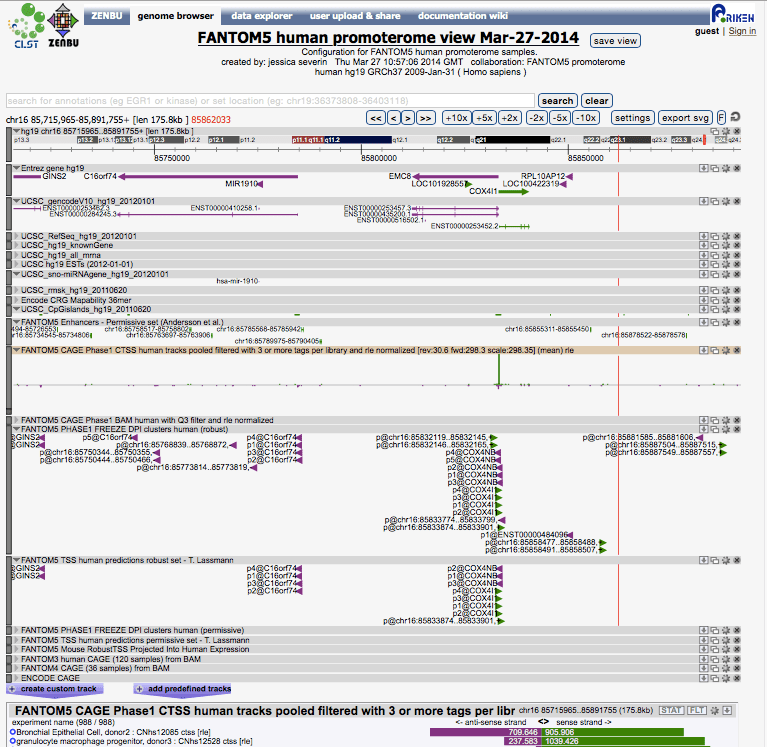
Zenbu
A new data integration, data processing, and expression enhanced visualization system with secured data upload and sharing designed for big data genomics projects (FANTOM5, FANTOM4, FANTOM3, ENCODE). Primary data visualization system for FANTOM5. Direct links for FANTOM5 promoterome views: hg19 and mm9. Direct links for FANTOM5 timecourse views: hg19 and mm9
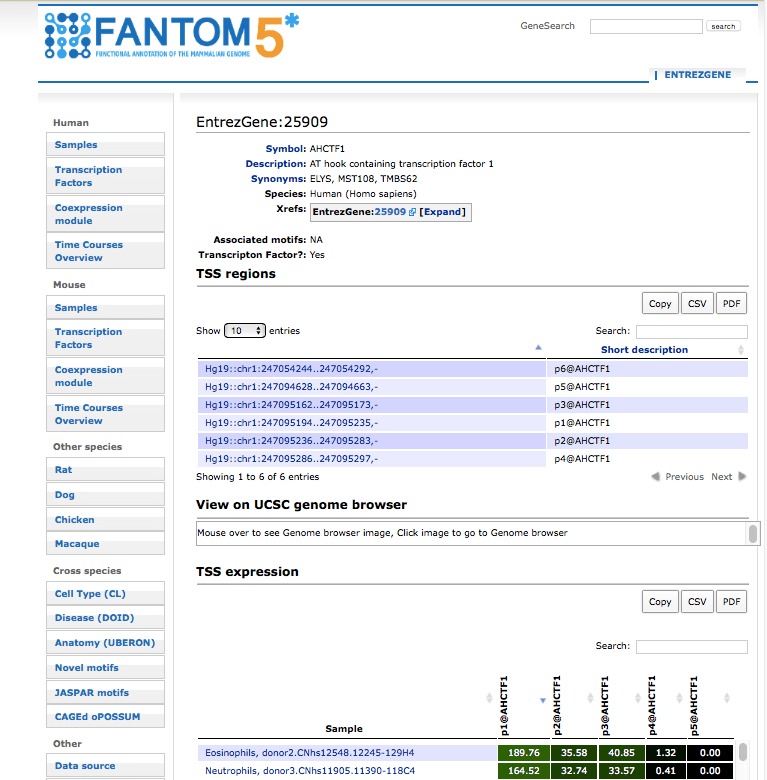
SSTAR
(Semantic catalogue of Samples, Transcription initiation, And Regulations) An interface to explore the cell type, co-expression cluster specific annotations, motifs and transcription factors. Summary of FANTOM5 time course samples.
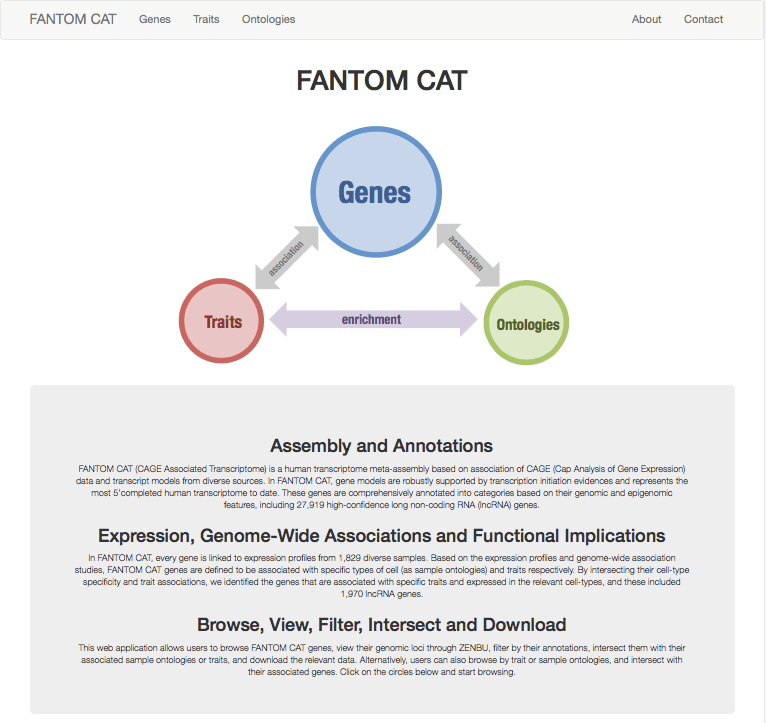
FANTOM CAT Browser
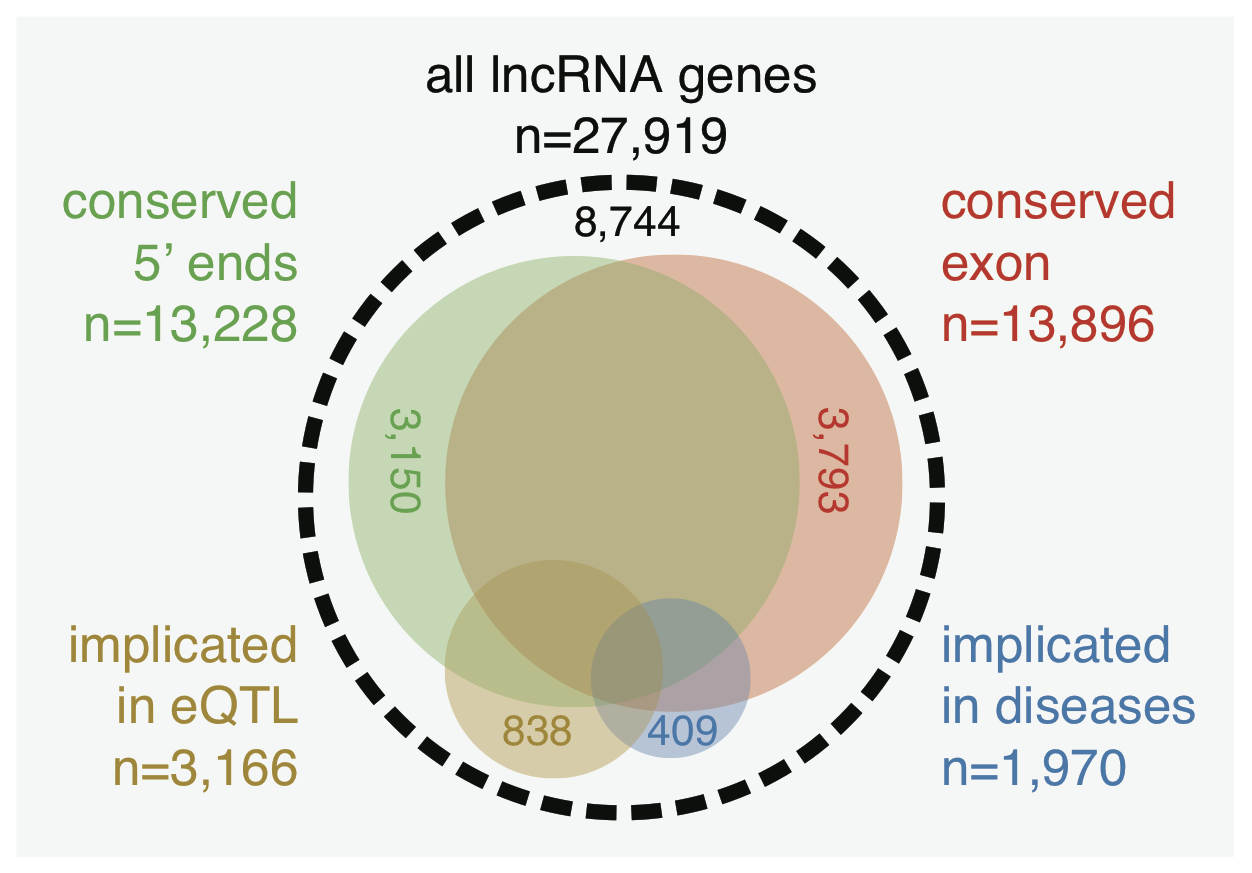
An web application allows users to browse genes, view their genomic loci through ZENBU, filter by their annotations, intersect them with their associated sample ontologies or traits, and download the relevant data.
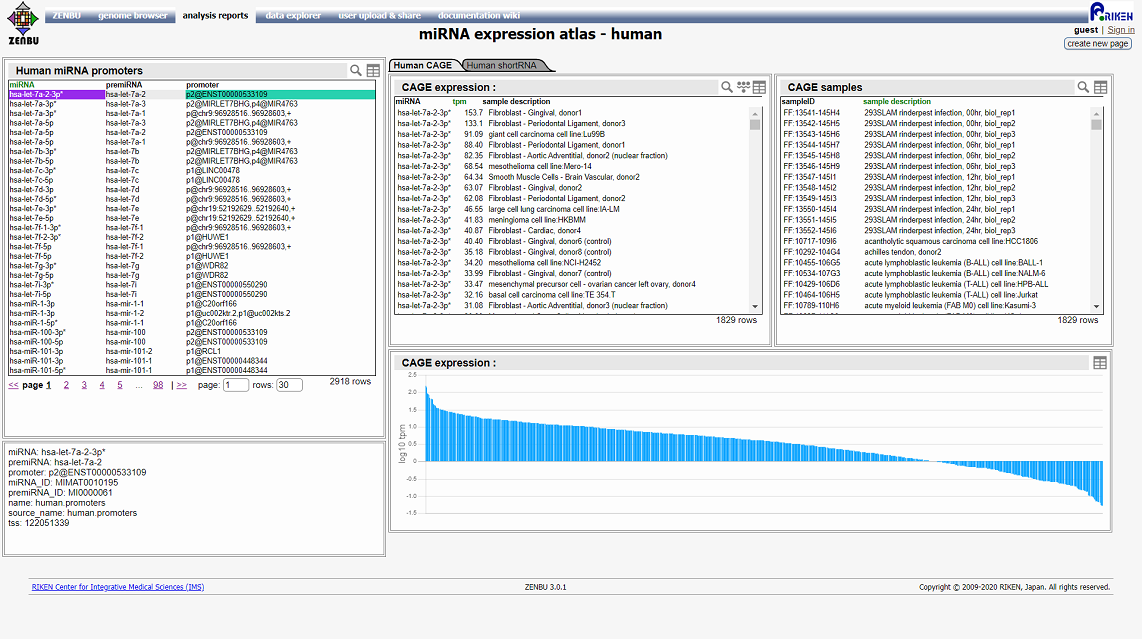
FANTOM5 miRNA atlas
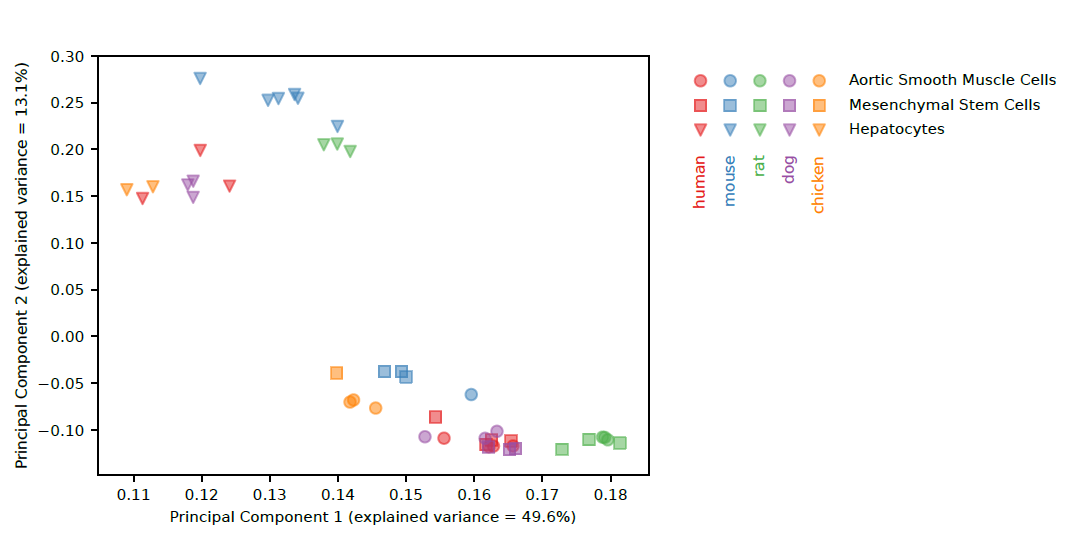
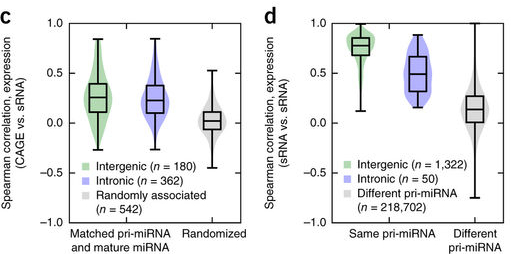
The FANTOM5 integrated miRNA expression atlas shows the expression patterns of miRNAs profiled by sequencing short RNA libraries obtained from human, mouse, rat dog and chicken samples. Both the sRNA expression profile of the mature miRNA and the CAGE expression profile of its associated promoter can be visualized. Enriched and depleted cell ontology categories are shown for each miRNA to summarize the expression profile.
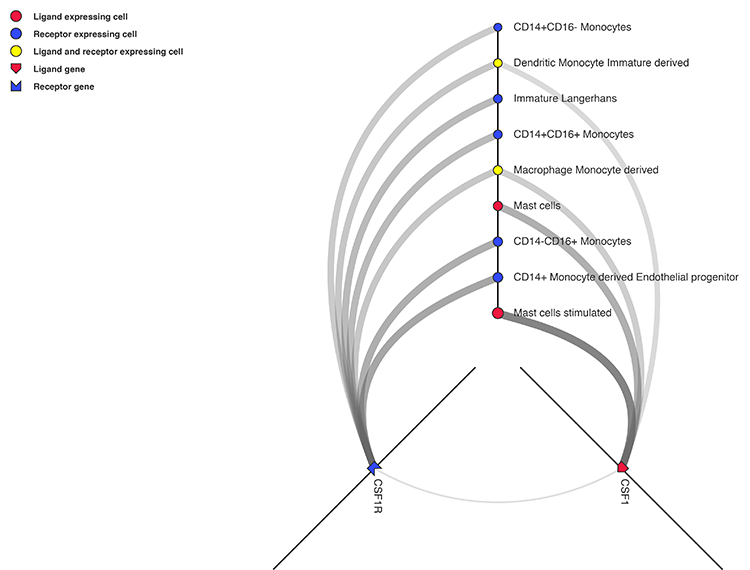
Cell Connectome Visualization
We constructed a signalling map between 144 major primary cell types in human connected through interacting pairs of secreted ligands and cell-surface receptors. Our visualization tool shows what ligands/receptors are present in given cells and what cells are connected to each other by the interacting pairs. Data is also available for downloading.
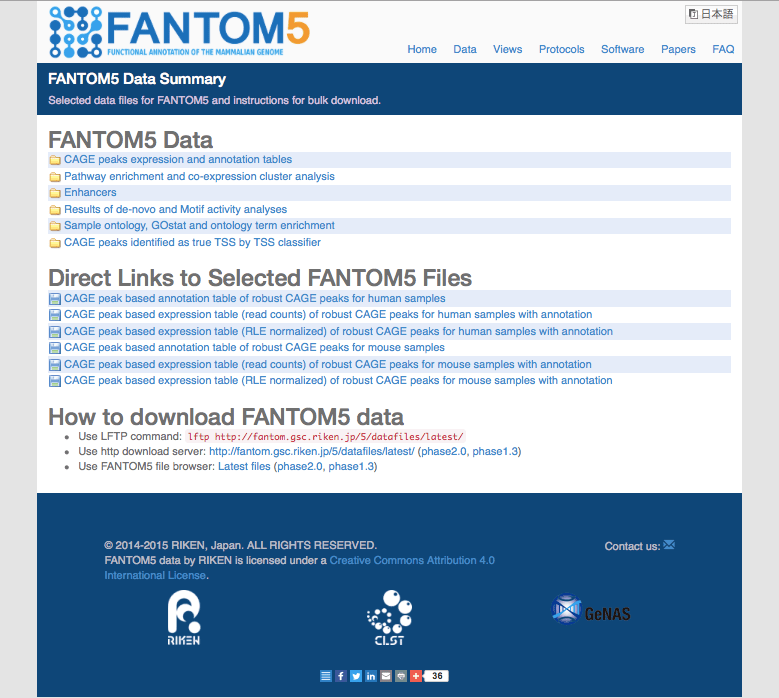
Files
Selected datafiles for FANTOM5. Alternatively you may view the data file server directly at http://fantom.gsc.riken.jp/5/datafiles/
Other Resources
TrackHub
FANTOM5 promoters, enhancers, lncRNAs and FANTOM5 cell lines on the UCSC Genome Browser Database, Asia mirror
TET
A system for extracting subsets of data from selected FANTOM5 data files including phase 1 and phase 2 expression tables.
How to cite
In addition to relevant papers, please cite the following paper for using data obtained from this site:Lizio M, et al. Gateways to the FANTOM5 promoter level mammalian expression atlas. Genome Biol 16: 22 (2015). 10.1186/s13059-014-0560-6
Abugessaisa I, et al. FANTOM enters 20th year: expansion of transcriptomic atlases and functional annotation of non-coding RNAs. Nucleic Acids Res 49: D892–D898 (2021). 10.1093/nar/gkaa1054

